Render Farm Price vs Performance Comparison
In this render farm price vs performance comparison we will be taking a different approach to comparing render farms by focusing on real world data collected through benchmarks and by the end you should have a better understanding of what to look for when comparing services with respect to price and performance.
Working out how two render farm’s compare is never simple. Many farms claim to be the fastest, cheapest and most efficient however even in the cases where these statements are true it is almost always misleading. You may be forgiven for thinking that the render farm with the lowest price is the cheapest, or that the render farm with the fastest machines is the most powerful but this is not true!
Based on the original Blender Render Farm Price vs Performance Comparison thread.
TLDR: If your just interested in the results jump to the Price vs Performance – The Results section.
Methodology
Benchmarking render farms is much more difficult than doing traditional CPU or GPU benchmarks. Render farms are often black boxes with respect to the hardware they are using and there is often no way to control for the current load on a farm from other users running jobs at the same time as you. In fact the render farm itself might not know what their current hardware availability looks like as they may be using resources from cloud services like AWS or even other render farms! Under these circumstances the price and render time of a scene can change day to day or even half way through a render so calculating the price and time to render a scene on render farm x is and always has been an exercise in heuristics.
Where benchmarking really shines with respect to render farms is in doing relative comparisons of each service. The two most important questions for artists are “How long will it take for me to get my results after job submission?” and “How much will the job cost me?”. Benchmarks might not give you a direct answer for either of these but they do allow you to pick the render farm which will perform the most competitively in both categories.
This test covered the comparison of nine render farms, some new to Radarrender and some that have been featured before. All benchmarks were carried out largely by one person (me) over a period of a few months in 2020 with the exception of Paperspace which was tested by a member of the blender community (blenderrocket). The tests started out as a thread on blenderartists.org so please check it out for the background context. In some cases farms provided free credits specifically for the tests, in others I made use of the free credits that come with creating a new account (a promotional feature offered by some farms) and on others I purchased my own credits.
Why Blender?
Blender is growing in all the most important areas yet it is still less well known for producing the large feature films and commercials that really require render farms to complete. Despite this there are still many reasons to use Blender over other applications like Maya or C4D when carrying out a render farm price vs performance comparison.

1. Blender is Free:
Since Blender is free for everybody (render farms and users) it makes it a great proxy for establishing the price of a render farm overall across it’s whole product stack. With other applications we would have to factor in the license costs some farms have to pay to use some applications and renderers.
2. Everyone Supports Blender:
Blender runs anywhere on anything for free! As a result almost every render farm supports Blender making it a brilliant common denominator for comparing farms.
3. CPU and GPU:
Since Blender’s Cycles rendering engine has first class support for both CPU and GPU rendering we can benchmark and compare all machine configurations offered by each farm.
4. Industry Recognised Benchmarking Tool:
Blender is recognised as a benchmarking tool in the wider hardware space making comparisons to single machine set-ups much easier. The Blender Foundation also has it’s own open data initiative for benchmarking single machines, not for distributed systems like render farms though.
Checkout our Blender Cycles and Eevee render farm comparison article for our in detail Blender render farm comparison
Benchmark Scene
A modified version of the Blender bwm demo scene was used for all the benchmarks. The scene was modified to turn it from a single frame render to a 25 frame animation. While some farms support single frame rendering most split up render jobs so that one frame is rendered per machine. I chose 25 frames as it was a good trade off between being enough frames to test each farms machine capacity and low enough to not be too expensive. I also used different versions of the scene for CPU and GPU tests so that the scene file was optimised for both settings.

Scene Download and Raw Data
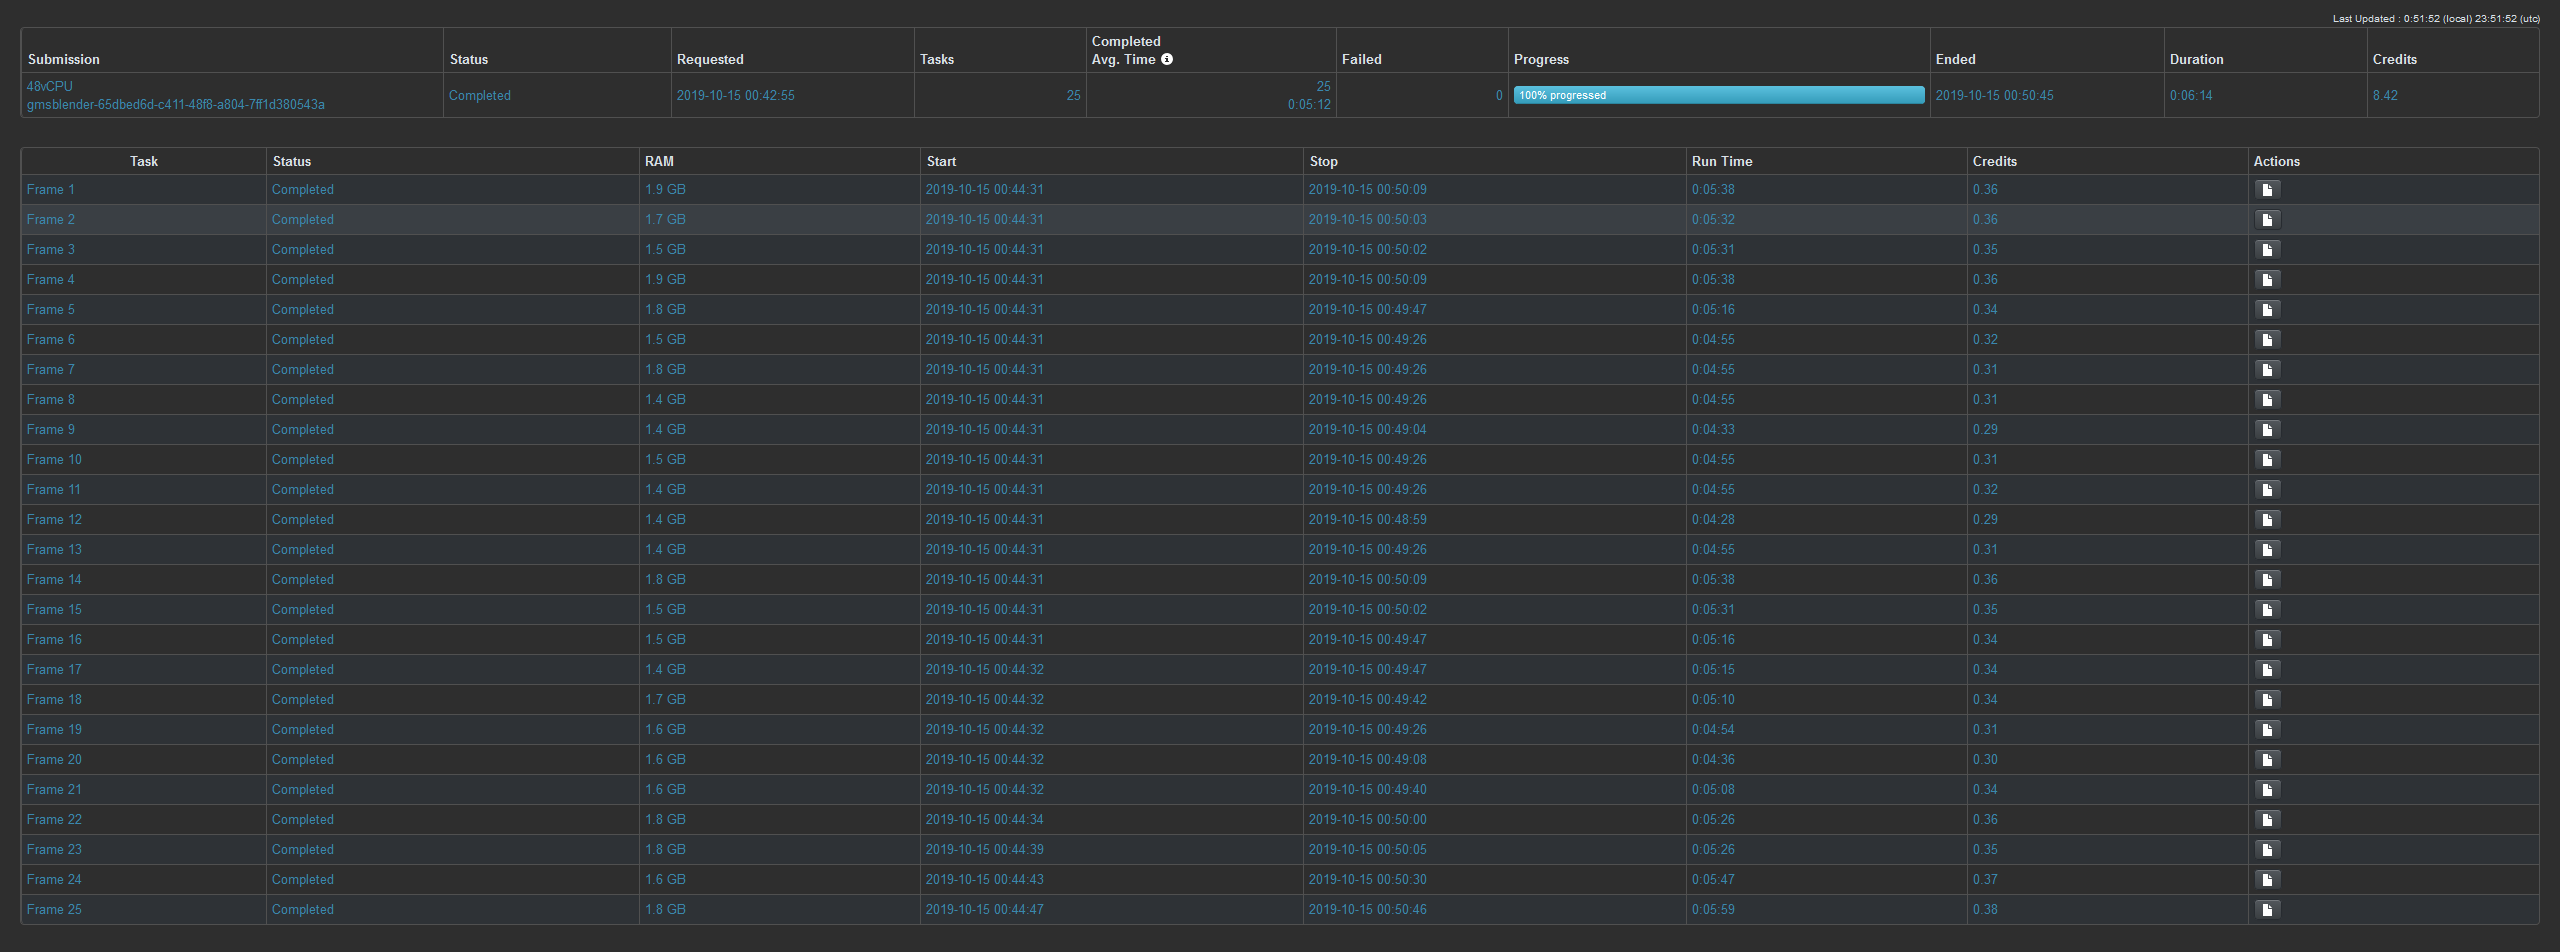
I have included all the .blend files used in the tests as well screenshots of the raw data as displayed by the render farms in this Google drive folder https://drive.google.com/open?id=1PKcE9ZEPgIA6a54DYwWg-83LyySelElt 1
I took a screenshot of the render results as shown by the render farms user interface. here is an example of one from GridMarkets:
Render farm Price vs Performance Metrics
When doing a render farm price vs performance comparison it is important to decide on the metrics you want to use for both price and performance. Many render farms use different metrics when advertising their services but I decided to use Effective Frequency (GHz) and Price ($ USD / GHzh) for my measurements. Below is an explanation of the two metrics, how they are being calculated and their units.
Effective Frequency (GHz)
I am defining the term effective frequency to mean the number of CPU cycles per second a single core CPU would have to exhibit to match the performance observed by the render farm. Basically it is a way of treating a render farm as if it were a single CPU (albeit a very high performance one).
I measured this by first calculating the render time of each benchmark scene I used on a local machine. Since the frequency and core count of the local machine was known I could estimate the number of CPU cycles required to render each .blend file. Some work could be done to improve this estimation (test on a wider variety of machines / operating systems, etc) but since it is the relative performance we care about any error here should not effect the conclusions.
The farms effective frequency can then be calculated using
eF = c / d
where:
eF = Effective Frequency (GHz)
c = Total CPU cycles required to render the benchmark (G CPU cycles)
d = Job Duration (s)
This is an especially useful metric for render farm price vs performance comparisons because it allows you to take into account differences in benchmark scenes.
Price ($ USD / GHzh)
$ USD / GHzh is the most common way of comparing render farm prices but the units can be hard to understand, I find it helps to think of them in SI units:
- $ USD = 1 US dollar
- GHz = 109 x cycle x second-1
- h = second x 3600
so the GHzh is actually equal to
- 109 x cycle x second-1 x second x 3600
- 109 x cycle x second -1 x second x 3600
- 109 x cycle x 3600
In this case the cycles we’re measuring are CPU clock cycles so you can think of ($ USD / GHzh) as the the number of US dollars you pay for 3600 x 109 CPU cycles.
I am again using the fact that we know how many CPU cycles it takes to render each test scene to estimate the price of each benchmark.
p = pi / (c / 3600)
where:
p = Render Farm price ($ USD / GHzh)
pi = Price ($ USD) to render job i
c = Total CPU cycles required to render the benchmark (G CPU cycles)
Prive vs Performance – The Results
After fifty three benchmark runs costing the equivalent of just over $250 and 30 hours render time we end up with below results. The Y axis represents price in $USD / GHzh (the lower the better) and the X axis is the effective frequency of the render farm configuration (higher is better).
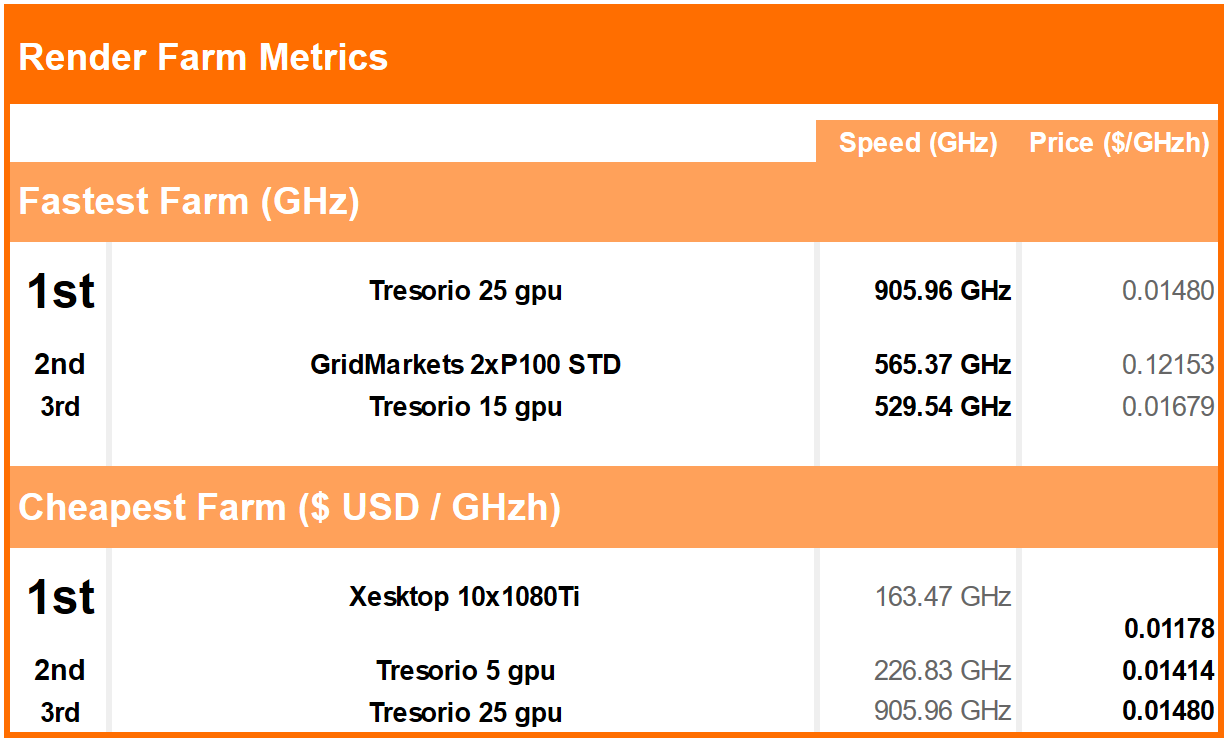
Best Performance – Tresorio
From the graph above you can see the clear winners from a performance and price perspective. Tresorio’s linear pricing model makes it the clear winner in terms of price, it also offers the best performance with it’s 25 GPU machine configuration.
Best Price – Xesktop
The cheapest service we found actually ended up being Xesktop’s virtual desktop offering. While not really a render farm if you just need a single powerful machine for rendering stills then this could be something to consider.
Points of Interest
There are also some curious cases which seem at first to make no sense. GridMarkets’ cheapest machine option by credits / hour (16vCPU) ends up being the most expensive and slowest option they offer. In fact with GridMarkets if you were to choose one of their GPU options it would end up rendering more than twice as fast for about half the cost! This illustrates why you should not assume cheaper machines will result in a cheaper render.
There are also the cases of Rebus Farm and GarageFarm who offer their services in terms of priority tiers. You will see that from the tests I ran using a higher priority made little difference to the effective performance but cost much more. This may be because the farms were under low load at the time so a higher priority didn’t make much difference. GarageFarm is unusual in that it lets you see load on the farm through it’s interface however with rebus there is no way of knowing that I could find.
Conclusion
From the modest number of tests run to gather the above data it would seem that Tresorio is the clear winner for price and performance. It is worth noting that at the time of these tests Tresorio was still in beta with respect to blender so it is possible that the overall load on their system was pretty low compared to some of the other farms tested. That said they were taking about offering even higher node count GPU options in the future so that is something to keep an eye out for.
It is also important to remember that for most of these render farm configurations only one job was run. A sample size of one is very limited but without access to free credits conducting benchmarks like these can quickly become very expensive.
There are also many other metrics that must be considered when comparing render farms such as the usability, the quality and open hours of their support team as well as the products and plug-ins they support. Radarrender aims to provide you with an unbiased means of comparing render farms on all these fronts but sometimes a deep dive into the data and a few graphs is all you need to see when choosing a farm.
Going Forward
Huge thanks to Hayley and the rest of the Radarrender team for letting me write this render farm price vs performance comparison post. My hope is over the next few months to turn the Google sheet I first created over a year ago into an open impartial source of render farm benchmark data that can be used by anyone through a set of custom APIs in true Blender open data fashion.
I am aware that there are many ways to improve the above tests from a methodology stand point. Having render farms know which user is running benchmark tests on their system theoretically makes it possible for a farm to cheat by bumping the priority the testing account without the tester knowing. It is important these tests reflect results any normal user could get running the test scenes themselves. I suspect the only way around this would be to have anonymous testing accounts but that complicates access to free credits which are what makes benchmarks like these feasible. Blender has also come a long way since I ran these benchmarks so the next set of benchmarks will likely be using the new LTS version of Blender and hopefully a new test scene.
If you own a render farm and would like to be included in the next set of tests, or if you have a question regarding how I conducted these tests please feel free to comment below or in the original blender thread.