
How the render farm pricing works?
1. What is Ghz hour?
Now there are many render farms showing their price per GHz hour or Core hour for CPU pricing. This cost calculation is confusing for a first-time user. Due to the various generations of hardware, online render farms try to find a common calculator namely GHzh for CPU Rendering Benchmark. However, there seemed to be ambiguous for users on how to charge the rendering service.
To build a price strategy by GHz hour, render farms calculate a sum of GHz hour from render nodes (or servers) you use. For example, a CPU Intel XEON E5-2670 v2 has 10 cores, each core has 2.5 GHz. The price is $0.004 per GHz hour. If you use the server having 2x Intel XEON E5-2670 v2, the price of 1 server/node/hour is 10 x 2 x 2.5 x 0.004 = $0.2/node/hour.
However, some render farms make users confused when offering a different price between by GHz hour and by node/hour. Let’s talk about Super Renders Farm.
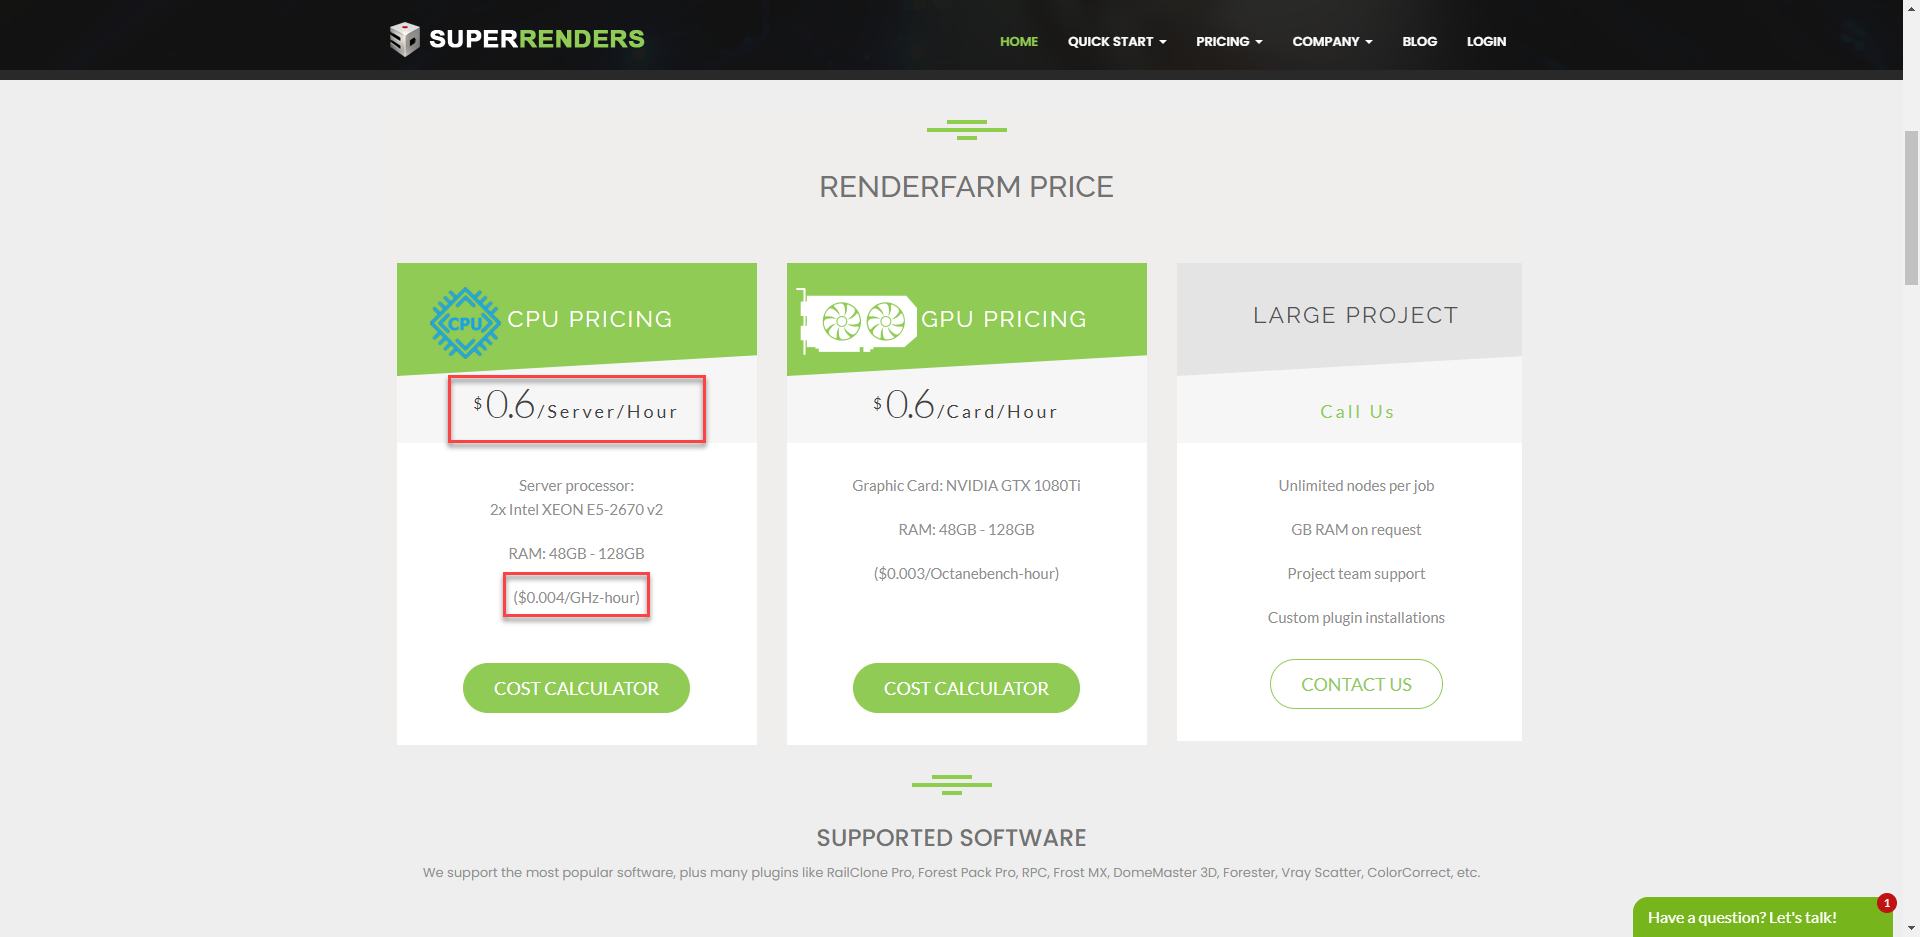
The aforementioned example that we take is from the CPU pricing of Super Renders Farm. The price per GHz hour is $0.004 for a CPU server including 2x Intel XEON E5-2670 v2. We calculate together that the price, when converted to per node/hour, is $0.2/node/hour. While the price per node/hour that Super Renders Farm offers on their website is $0.6/node/hour, which makes customers quite confused.
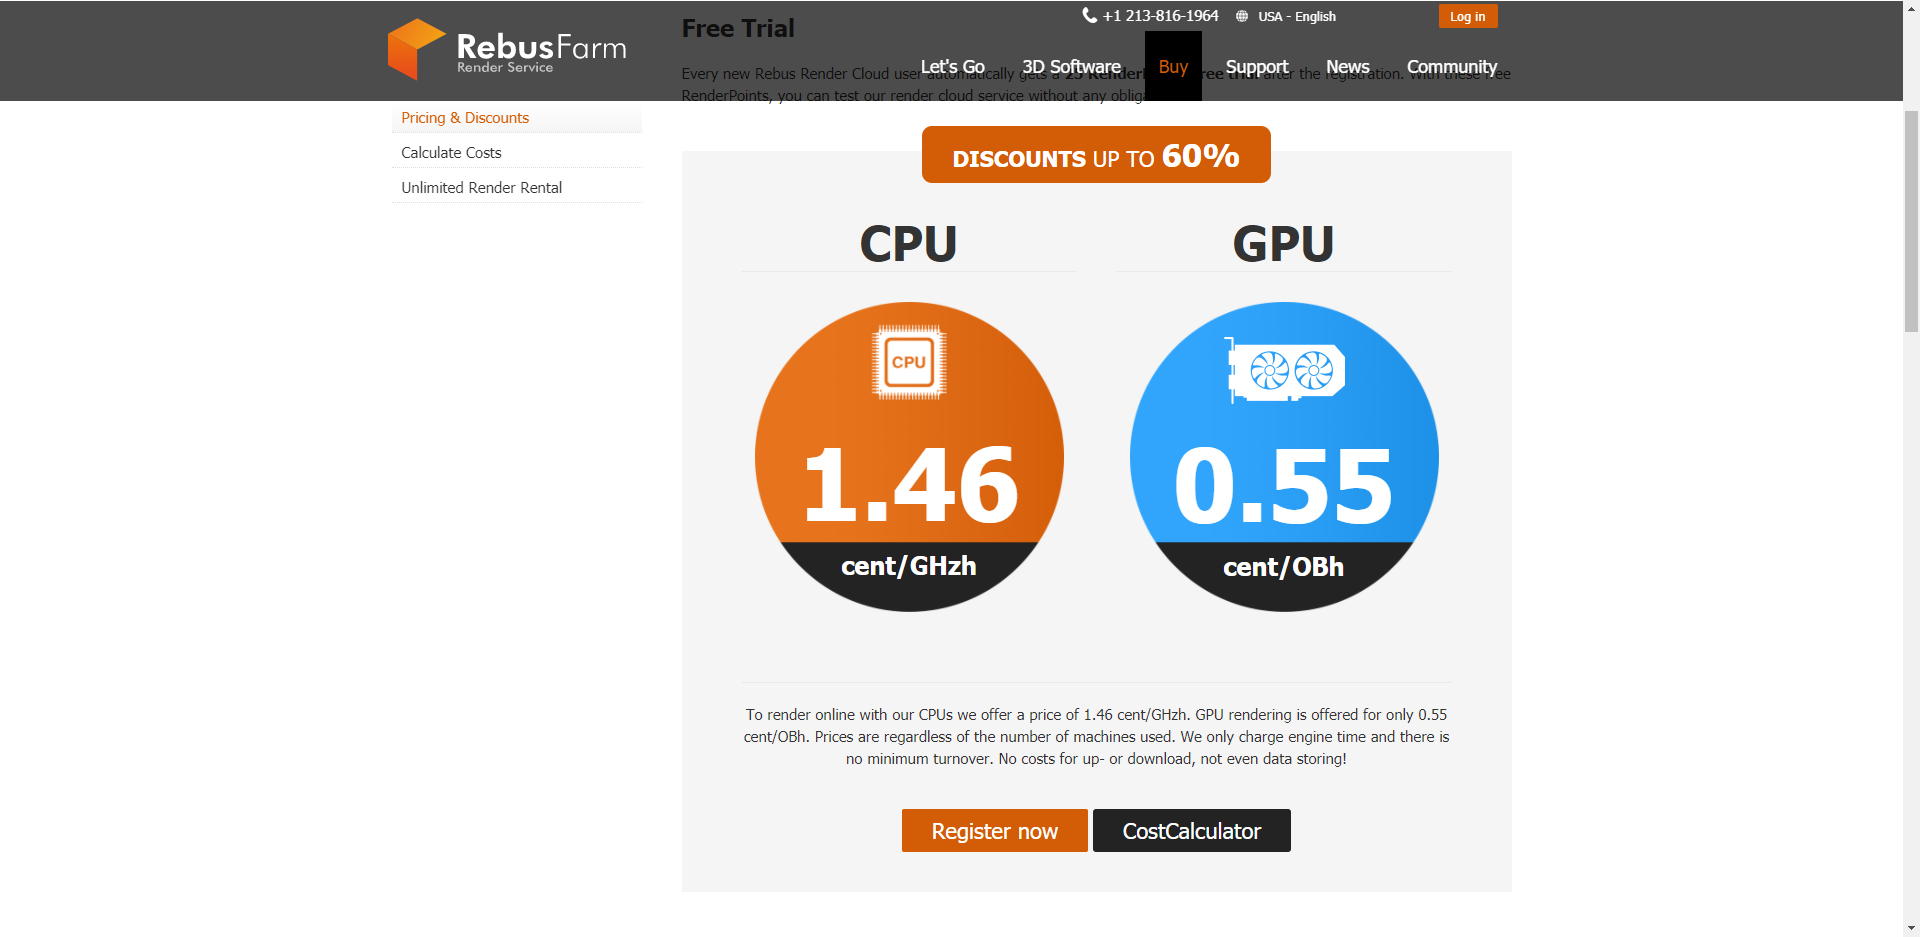
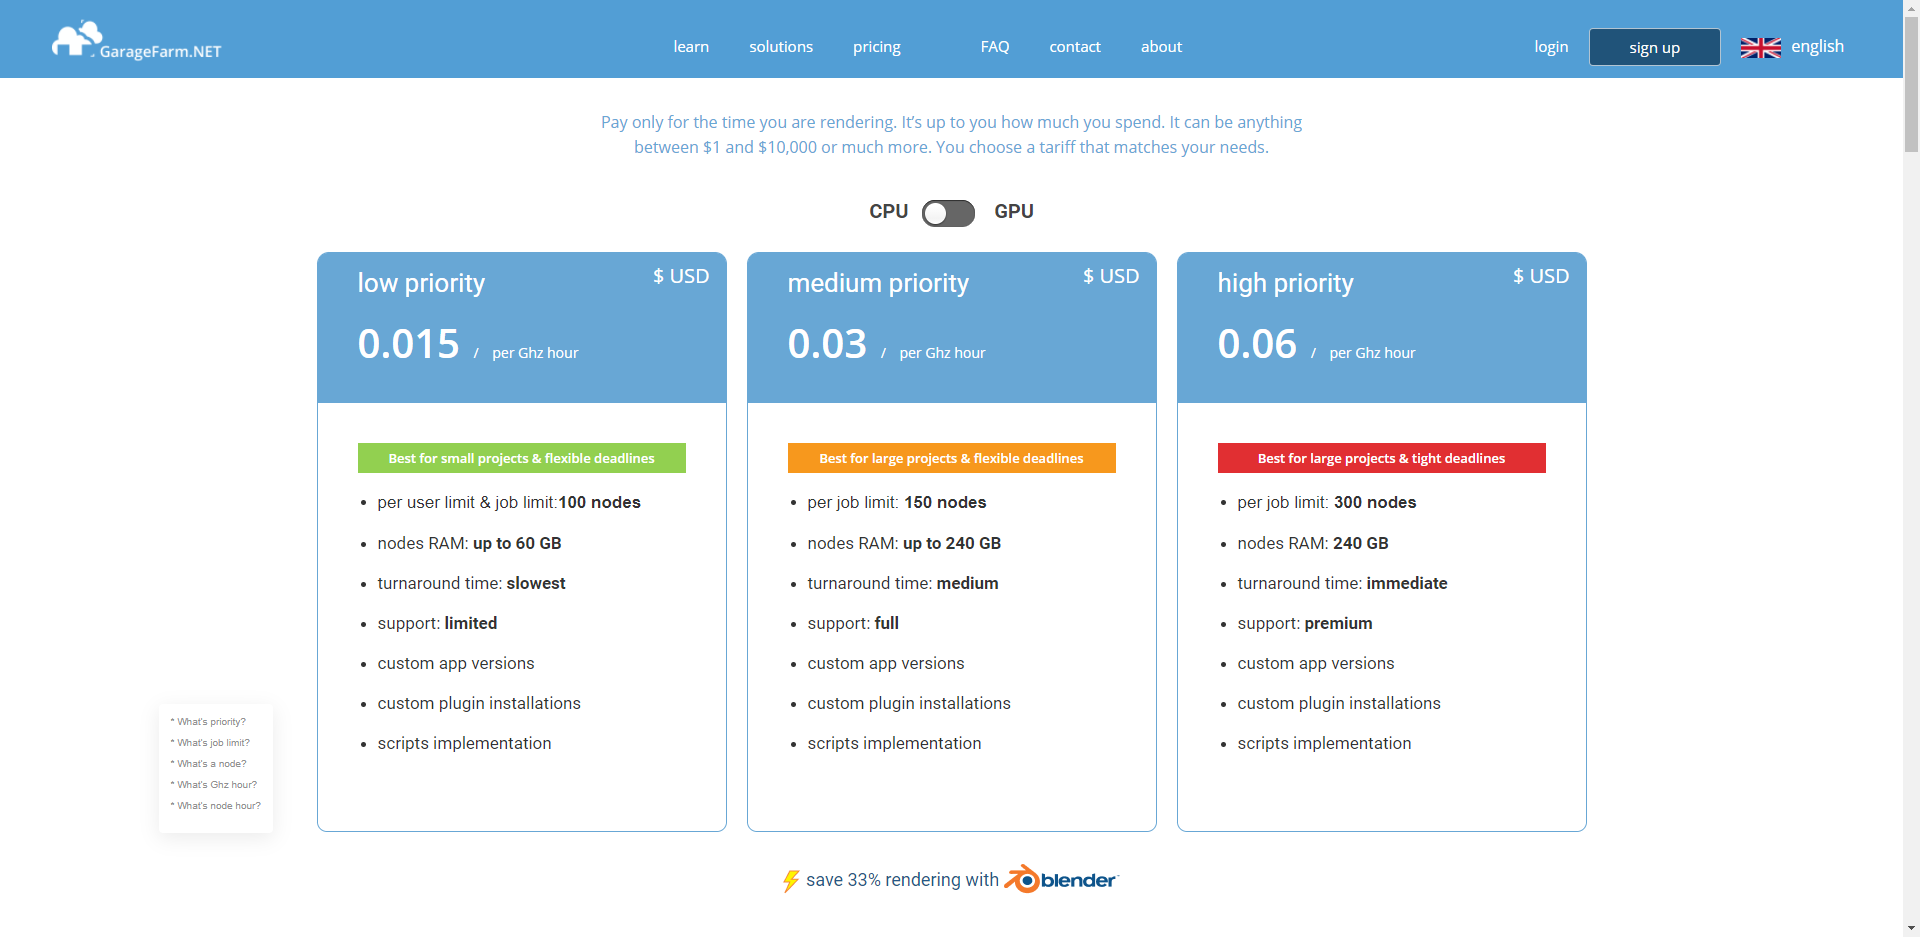
Some render farms that apply the cost calculation by Ghzh and OBh are RebusFarm, GarageFarm, RanchComputing, etc. The common point of these render farms is they offer the SaaS model.

2. What is OctaneBench hour?
OctaneBench is currently the most popular GPU Rendering Benchmark created by Otoy as a tool to define the general compute power afforded by any combination of graphics cards in a computer. The score is calculated from the measured speed (Ms/s or mega samples per second), relative to the speed Otoy measured for a GTX 980. The ratio is weighted by the approximate usage of the various kernels and then added up. If your score (or Octanebench score) is under 100, your GPU is slower than the GTX 980 we used as a reference, and if it’s more your GPU is faster. Here’s the list of GPUs and their Octancebench score created by Otoy.
A render node, for example, has 1x GTX 1080Ti, the Octanebench score is 192 and the price per Octanebench hour (OB hour) is $0.003. It means that the price per node-hour is: 192*0.003 = 0.576$/node/hour.
Some render farms that apply the cost calculation by Ghzh and OBh are RebusFarm, GarageFarm, RanchComputing, etc. The common point of these render farms is they offer the SaaS model.
3. Is calculation by GHz hour or OB hour accurate?
From my point of view, the cost calculation by GHz hour or OB hour is not the good one. Users often find it hard to understand how the render farm pricing works and render farms find it hard to estimate the rendering cost. According to Render Street, the definition can be ambiguous or misleading. Let’s take a depth look into this subject:
- Not all cores are created equal. Let’s take two server CPUs as an example. The two CPU servers are from the Intel brand, especially from the Xeon line: Xeon X5670 @ 2.93GHz and Xeon E5-2667 @ 2.90GHz. They have the same number of cores and almost the same core speed. You will notice that the second one is 23% faster than the first one, even if it has a slightly lower frequency. The first one is from the 2010 generation (and it’s likely you can still find it in some farms), and the second one has been released in 2012. Going further, the AMD Opteron 8439 SE @ 2.80GHz CPU has almost the same characteristics as the two Intel CPUs in terms of cores and speed, but its performance is half of the Xeon X5670.
- The definition of a core can vary from farm to farm. Some of them don’t even tell what kind of machines they have, but only the number of cores and the core speed. For instance one of the farms says they have ‚Xeon 8-core and 12-core machines with 3.0 GHz speed’, while another specifies they have ‚Intel Xeon E5645 * 2, 16 cores’. Some of the farms consider one core with hyperthreading to be two separate cores, so you’ll need to pay attention to that as well.
- The same logic applies to GHz-hour. Obviously, taking the two Intel CPUs compared above, one GHz from the second machine is 23% faster than a GHz from the first machine. So the actual value is 23% higher. Moving to the AMD CPU, the same GHz has only half of the performance.
In addition, the majority of current render farms are based on the SaaS model (Software-as-a-Service). So the cost calculation by Ghzh or OBh is much vague for users. It is because users do not know which specific hardware that a render farm is offering or how many nodes are being used under their system. In themselves, the Ghzh and OBh are not very informative, since users have no basis of comparison. Therefore, it’s hard to compare the pricing and render time among SaaS-based render farms, and users cannot find which one is the best offer for them.


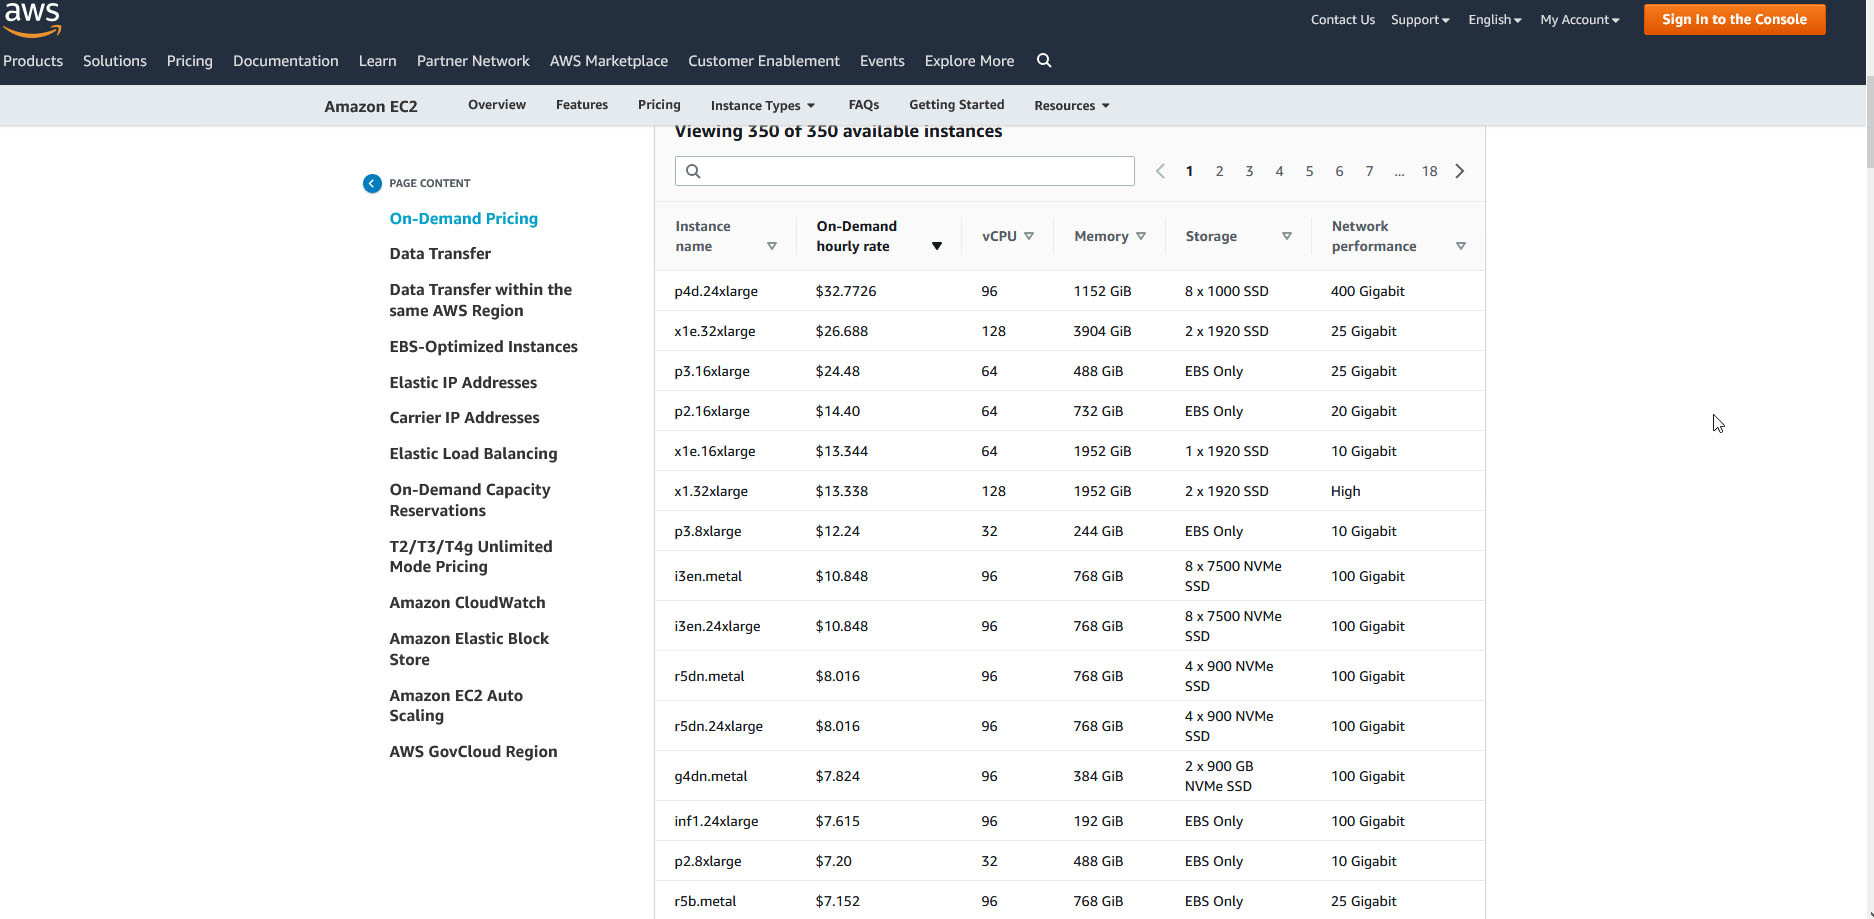
The render farm price per Ghzh or OBh is only an estimation way. The reasonable way to compare prices and render time among render farms for a given project is to check the benchmark on your own and compare the prices based on render nodes/servers. It means that some render farms such as iRender or AWS ec2, etc., when offering the IaaS model (Infrastructure-as-a-Service), transfer the control right to users, so users can get access to the remote servers and check whether the machine specs are exactly as what the render farm said or not, as well as benchmark the server hardware. This way is totally transparent and clear for customers while using render farm service.
See more: 7 best render farms comparison
What looks to be the better price isn’t always so. You may get more rendering per buck from a farm that seems to be more expensive, but in fact, gives you more performance for the same amount. And that’s strictly in terms of hardware. It can be said that the most transparent way to calculate render farm pricing is per node per hour, and users can check exactly the offered machine specs.